Home Dashboard
The following data is visible on the ShowMS home dashboard:
- Users - the total number of users across all platforms in the last seven days.
- Video Starts - the total number of video starts across all platforms in the last seven days.
- Minutes in Playback - the total time spent watching videos across all platforms in the last seven days.
- Active Users - the total number of users currently active across all platforms.
- US Users by Platform by Hour - a chart comparing the number of users on each platform in the last seven days.
- Video Starts by Platform by Hour - a chart comparing the number of video starts on each platform in the last seven days.
- Video Starts by Show by Hour - a chart comparing the number of video starts of the most popular shows in the last seven days.
- Recently Published - a list of the most recently published articles across all shows and sections.
- Up Next Articles - a list of articles scheduled to be published across all shows and sections.
Show Dashboard
The following data is visible on each show's dashboard:
- Viewers - the total number of viewers for the show across all platforms in the last seven days.
- Video Starts - the total number of video starts for the show across all platforms in the last seven days.
- Minutes in Playback - the total time spent watching that show across all platforms in the last seven days.
- Next Episode - if the show is currently in season, a live countdown shows the day and time of the next live episode.
- Video Starts by Platform for [Show] by Hour - a chart comparing the number of video starts for the show on each platform in the last seven days.
- Video Starts by Episode for [Show] by Hour - a chart comparing the number of video starts for the most popular episodes of the show in the last seven days.
- Recently Published - a list of the most recently published articles for the show.
- Up Next Articles - a list of the articles scheduled to be published for the show.
Reports Overview
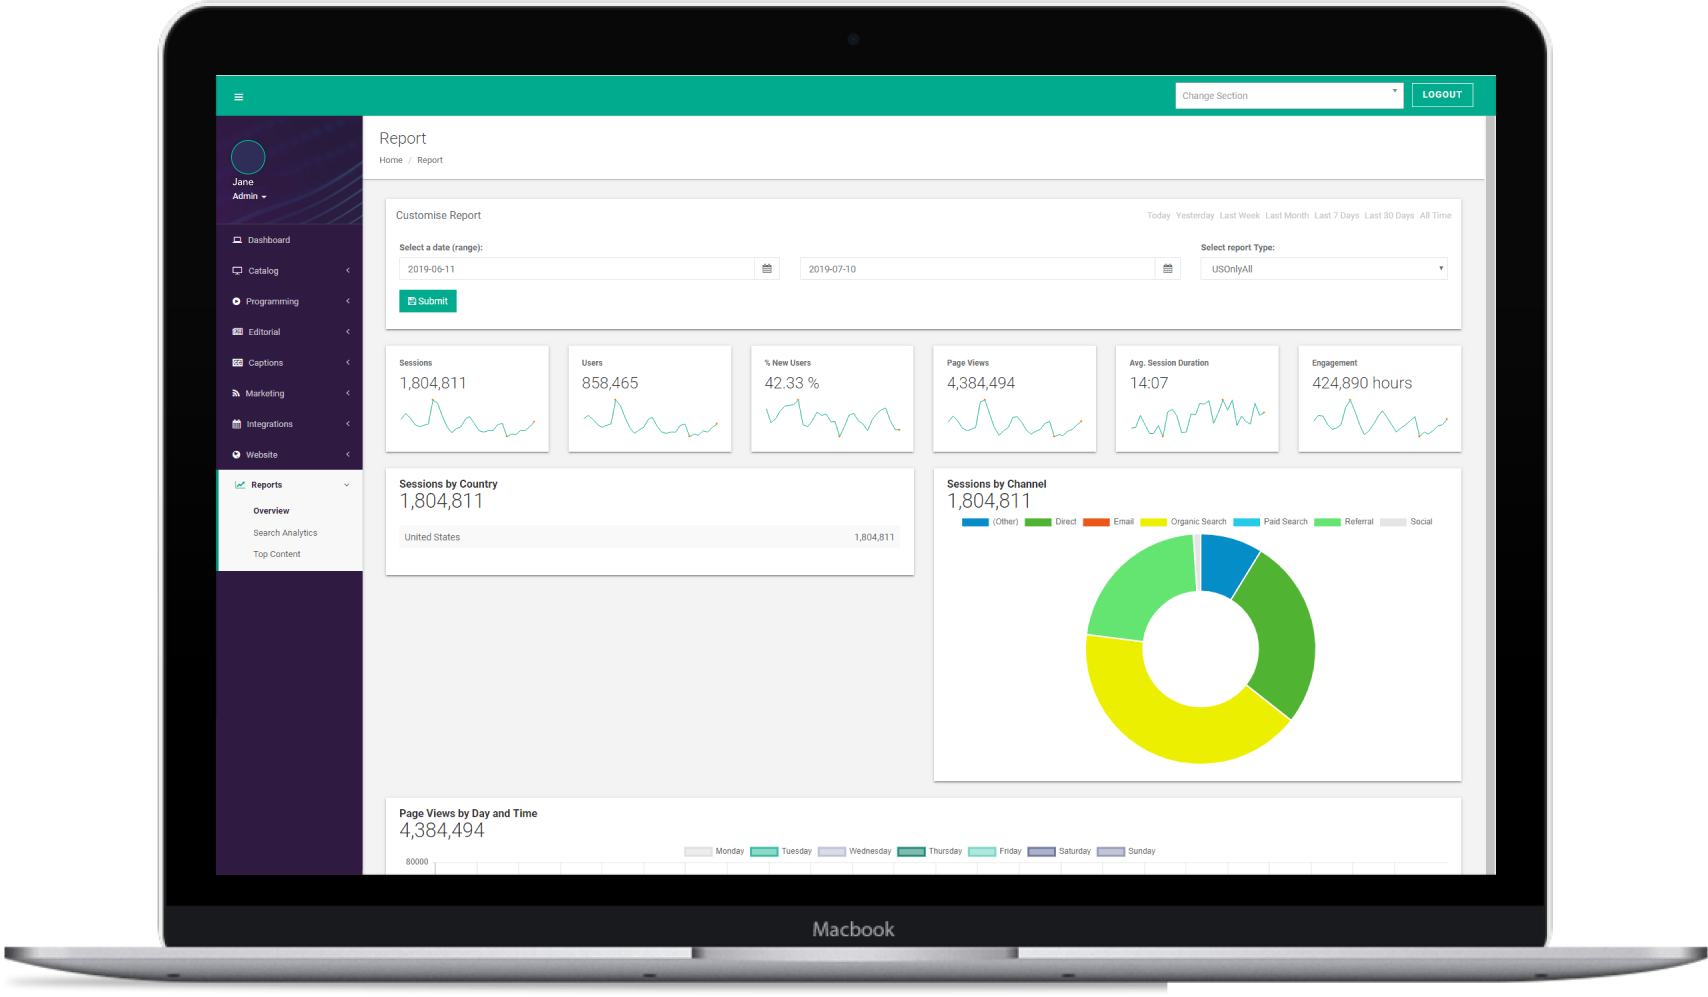
In addition to the dashboards outlined above, the Reports area of the admin has an Overview page providing data across all platforms that can be filtered by a selected date range, location and device.
- Sessions - the total number of sessions.
- Users - the total number of users.
- % New Users - the percentage of users who are new to Freeform platforms.
- Page Views - the total number of page views.
- Average Session Duration - the average length of a session.
- Engagement - the total length of time spent engaging with content.
- Sessions by Country - the total number of sessions for each country.
- Sessions by Channel - a pie chart comparing the total number of sessions for each channel.
- Page Views by Date and Time - a bar chart comparing the total number of page views every hour within the last week.